TimeControl BI
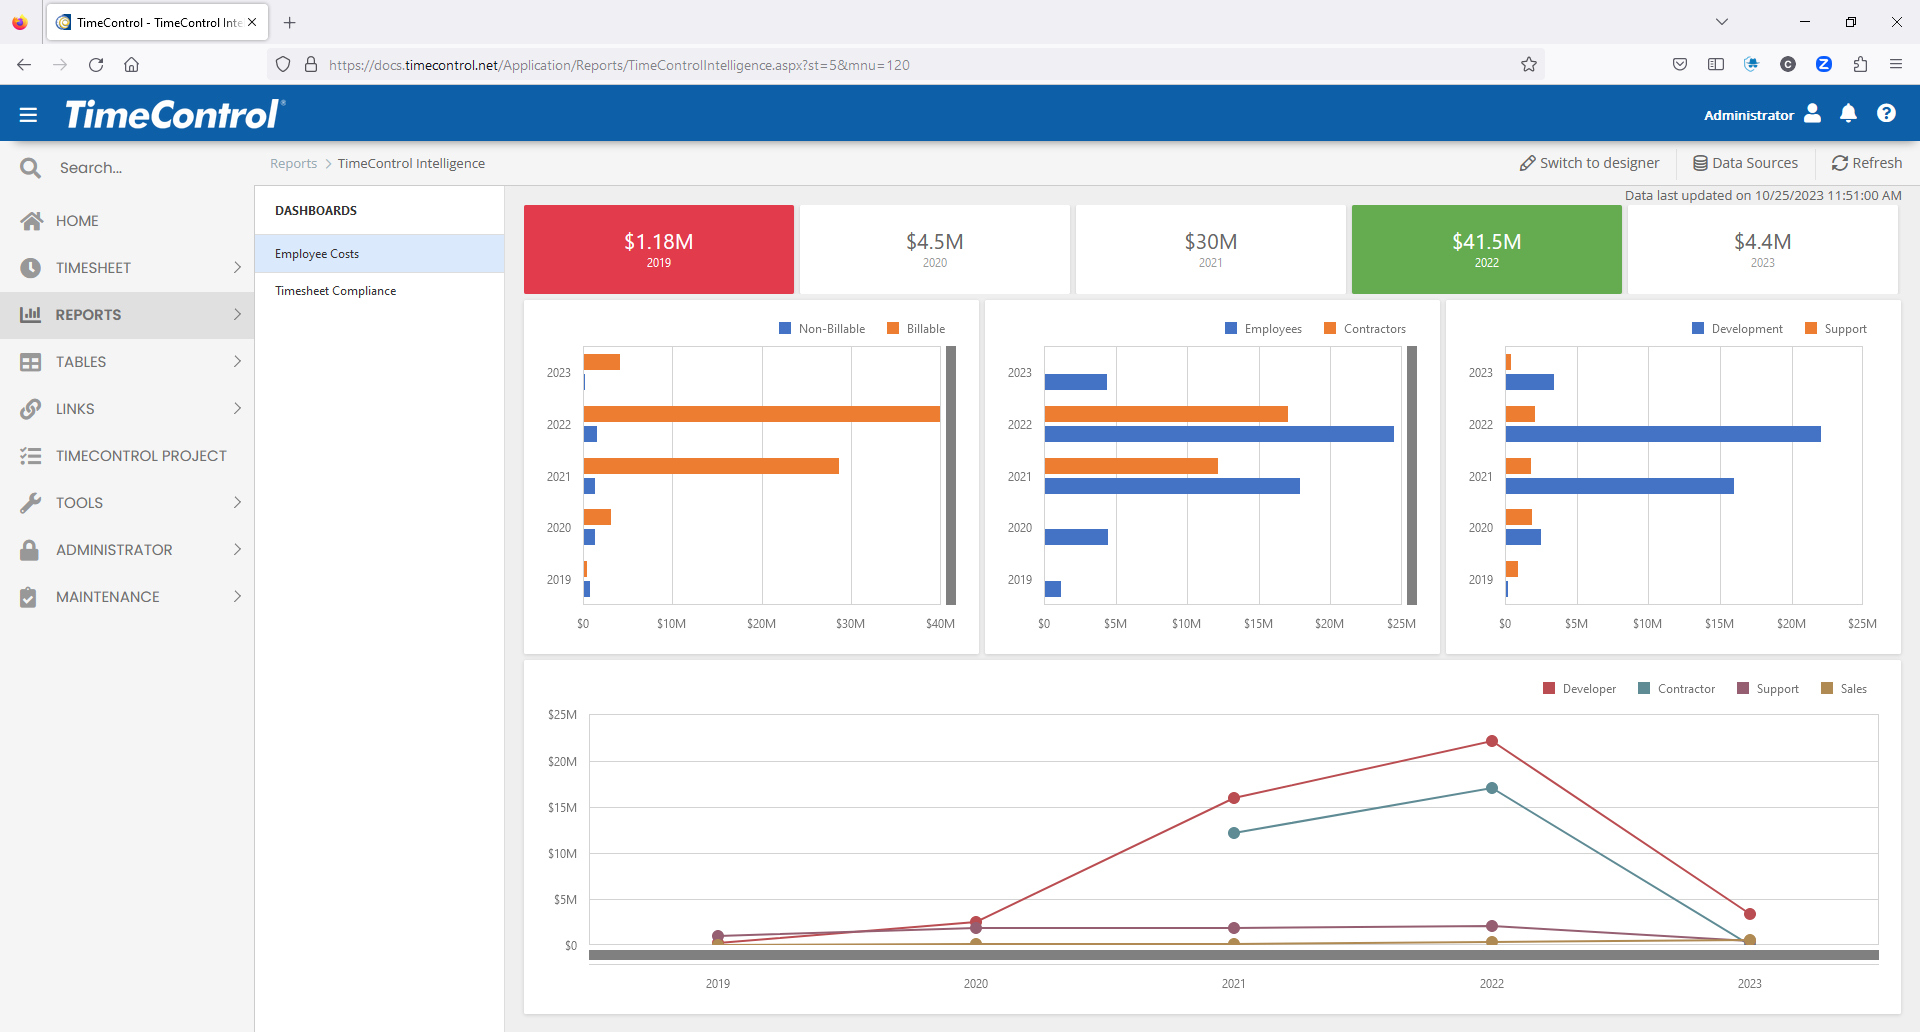
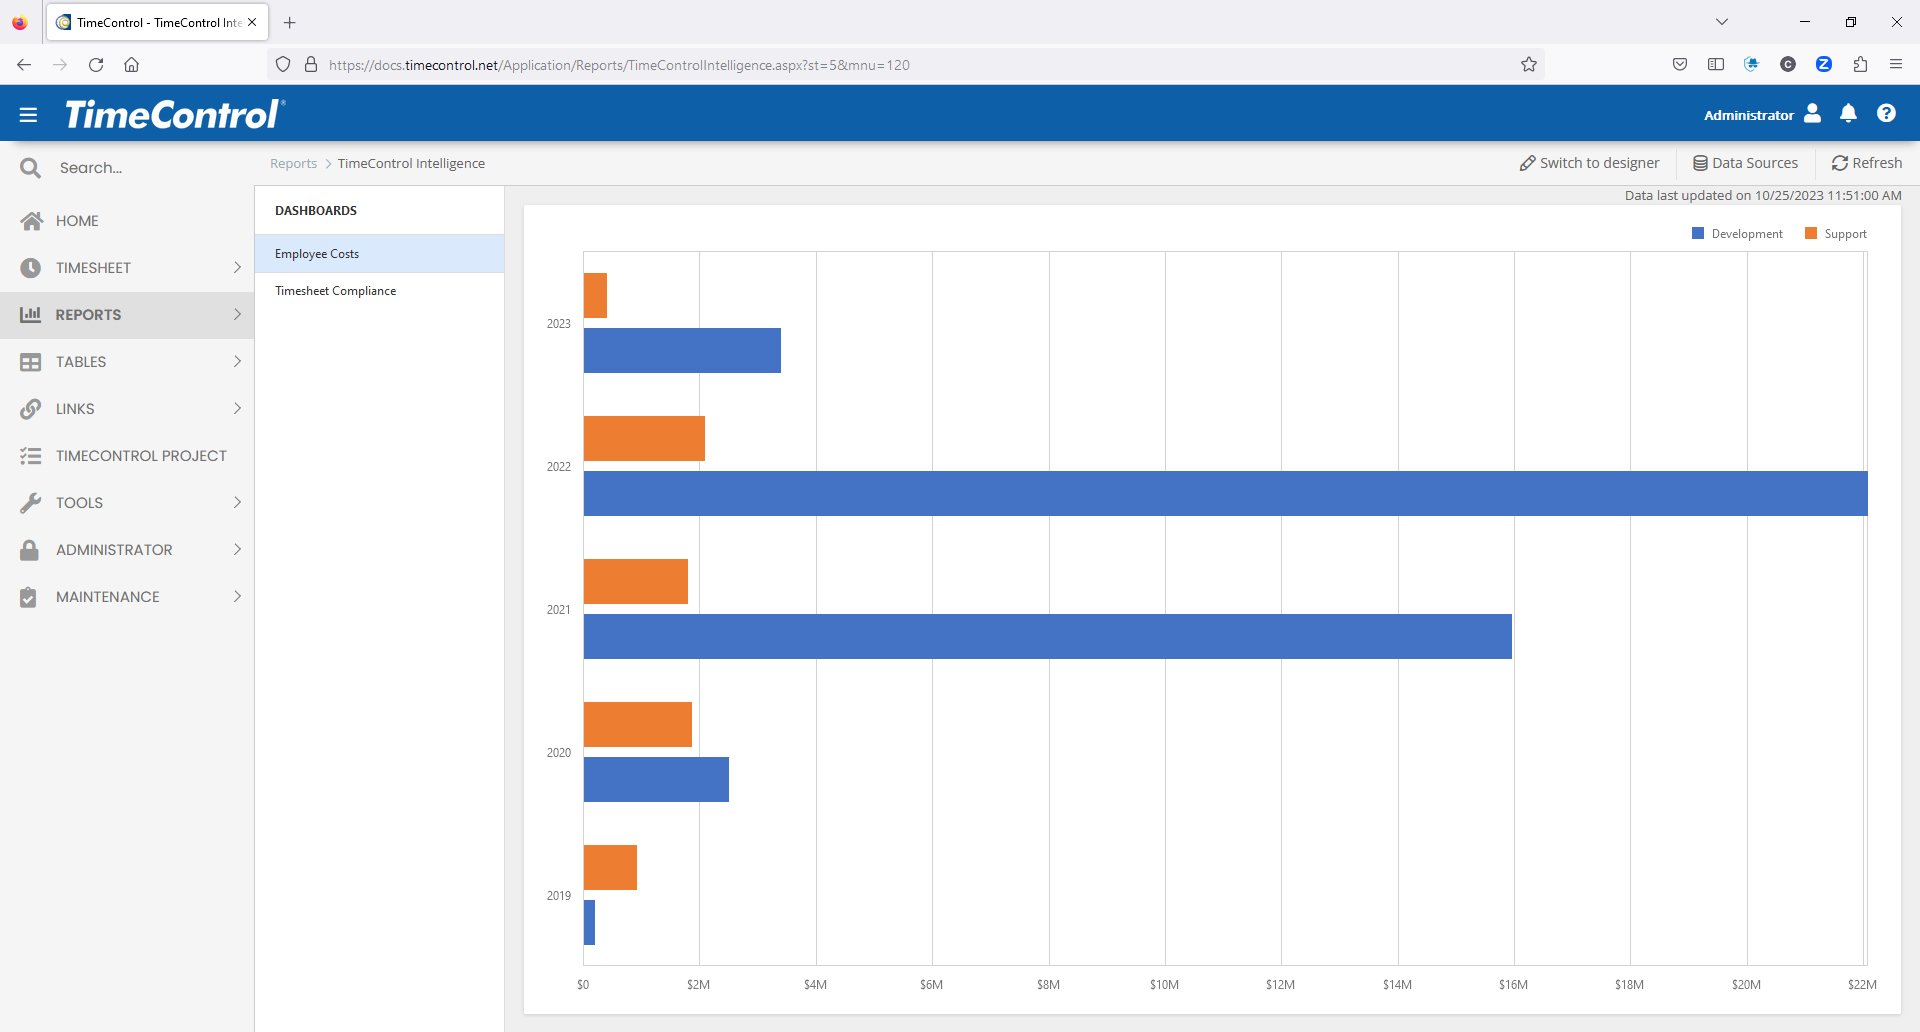
TimeControl includes a Business Intelligence Dashboard engine that has extensive data visualization capabilities. It allows both technical and non-technical users to create views of data and synthesize high volumes of data into understandable decision making points.

Where the TimeControl Dashboard allows operational views of what is happening in TimeControl right now for all users to consume, TimeControl BI goes into larger volumes of data to analyze, group, summarize and visualize that data into charts, graphs and more. Where in the TimeControl Dashboard you might see a list of missing timesheets, TimeControl BI can reach back into TimeControl’s data to say on average over the last five years how many timesheets are turned in on time each week and is that number improving or not.
Flexibility
TimeControl's What You See Is What You Get (WYSIWYG) Report designer is capable of producing reports on any timesheet data or any table of data within TimeControl. Click to see full-sized image Reports can be tabular or graphical. They can include logos, pictures, charts, pivot tables, calculated fields and more with complete layout and font control over every element. The report format is created using the full-screen TimeControl Report Designer and once created, the report can be viewed by any user who has been given rights to it in our TimeControl Report Interface. Reports in this format can be viewed with any browser or on any device including tablets and smartphones.
Secure
Security of the TimeControl BI environment is defined in the User Profiles area. First, an Administrator can determine if a user should be able to see the TimeControl BI menu selection at all in Menu Security. Next, in the Report Security BI area, the Administrator can define which of the pre-defined TimeControl BI Dashboards are visible to users with users having a particular User Profile. Finally, the Administrator can determine if these users can create new TimeControl BI Dashboards and Edit or Delete existing Dashboards.


